Exploring Soccer Strategy and Tactics Visually Using StatsBomb Data
In this little project, I was messing around with StatsBomb soccer data. I imagined myself being part of the German Women’s national team staff, analyzing the English team right before their finals game in the European Championship 2022.
After finishing my PhD analyzing the NBA, I wanted to look at the sport I played as a teenager again, to see what the data and analytics landscape looks like. So keep this in mind, when reading my thoughts and checking my plots here. Basketball-mind switching sports just for fun to check out the incredibly interesting StatsBomb database, hoping to learn something from interdisciplinary application of methods.
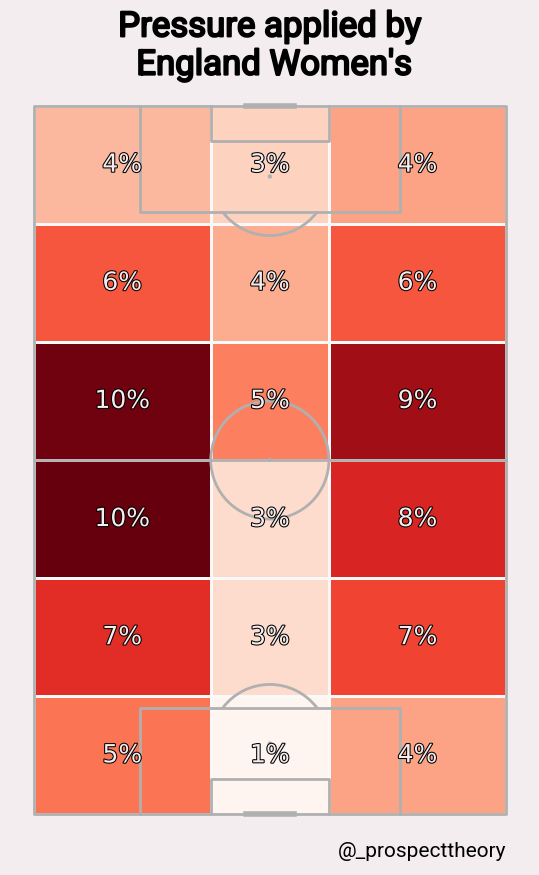
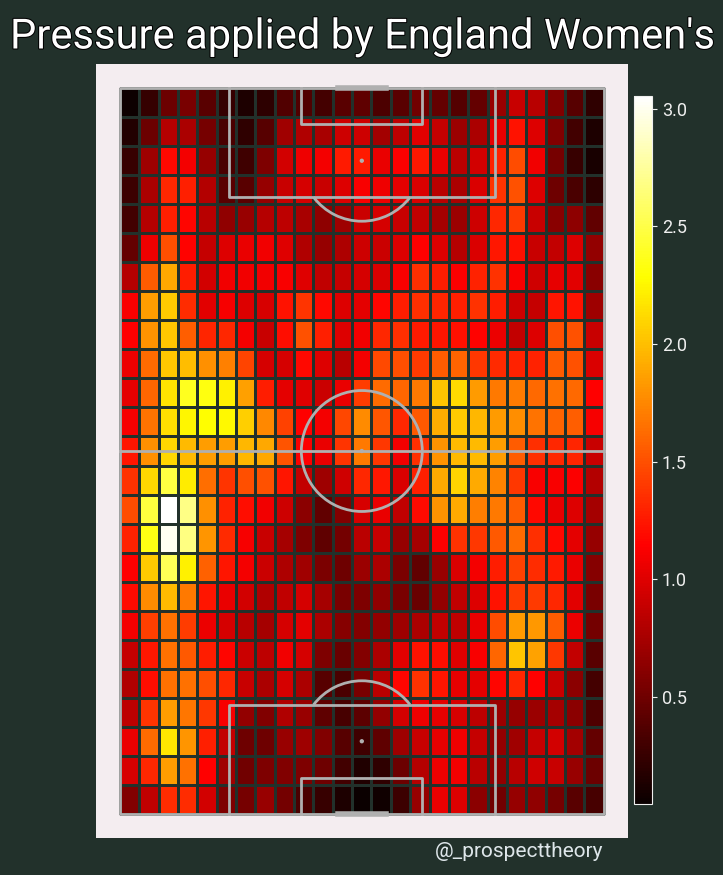
- Heatmaps allow us to analyze from which directions a team likes to apply pressure.
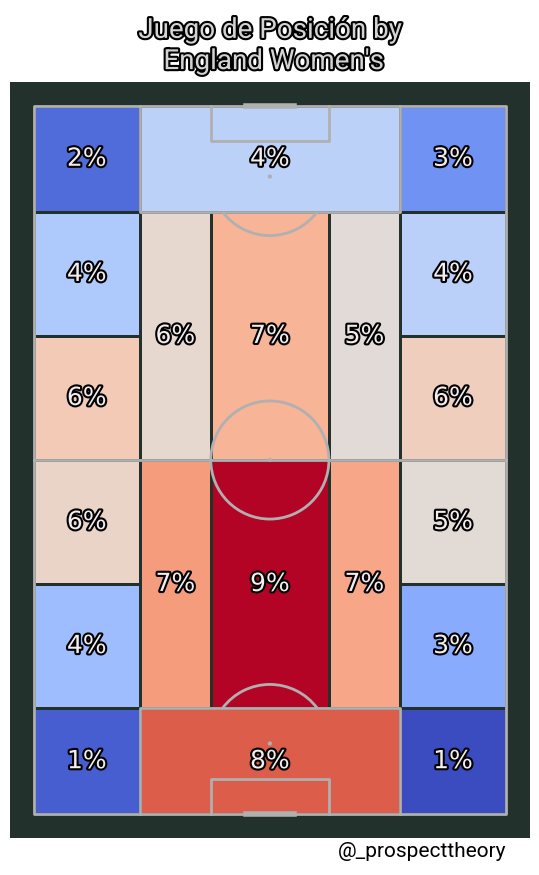
- Juego de Posición is an interesting concept to determine in what areas of the pitch a team tends to possess and handle the ball the most.
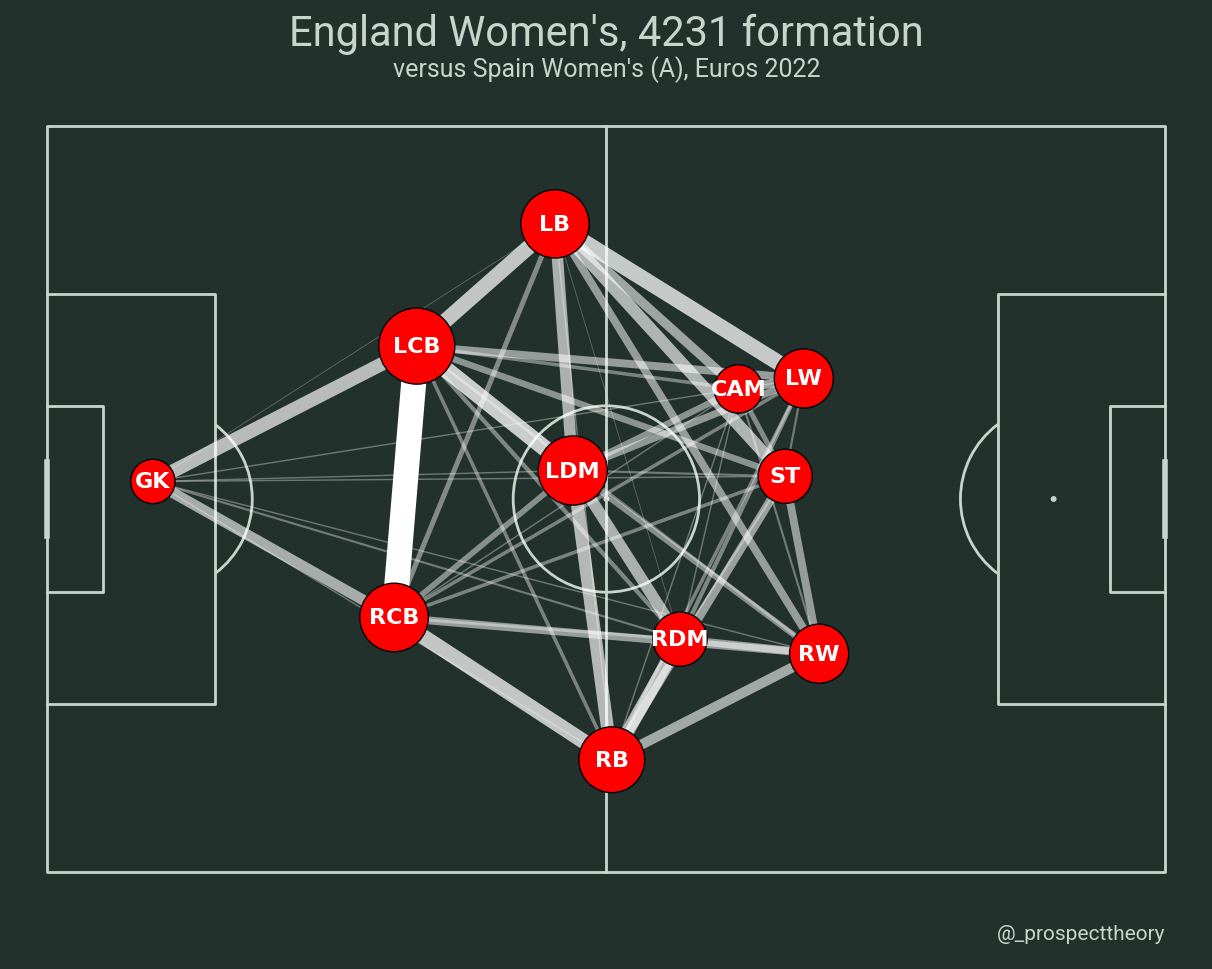
- Passing networks allow us to see which connections are most used and most essential for a team.
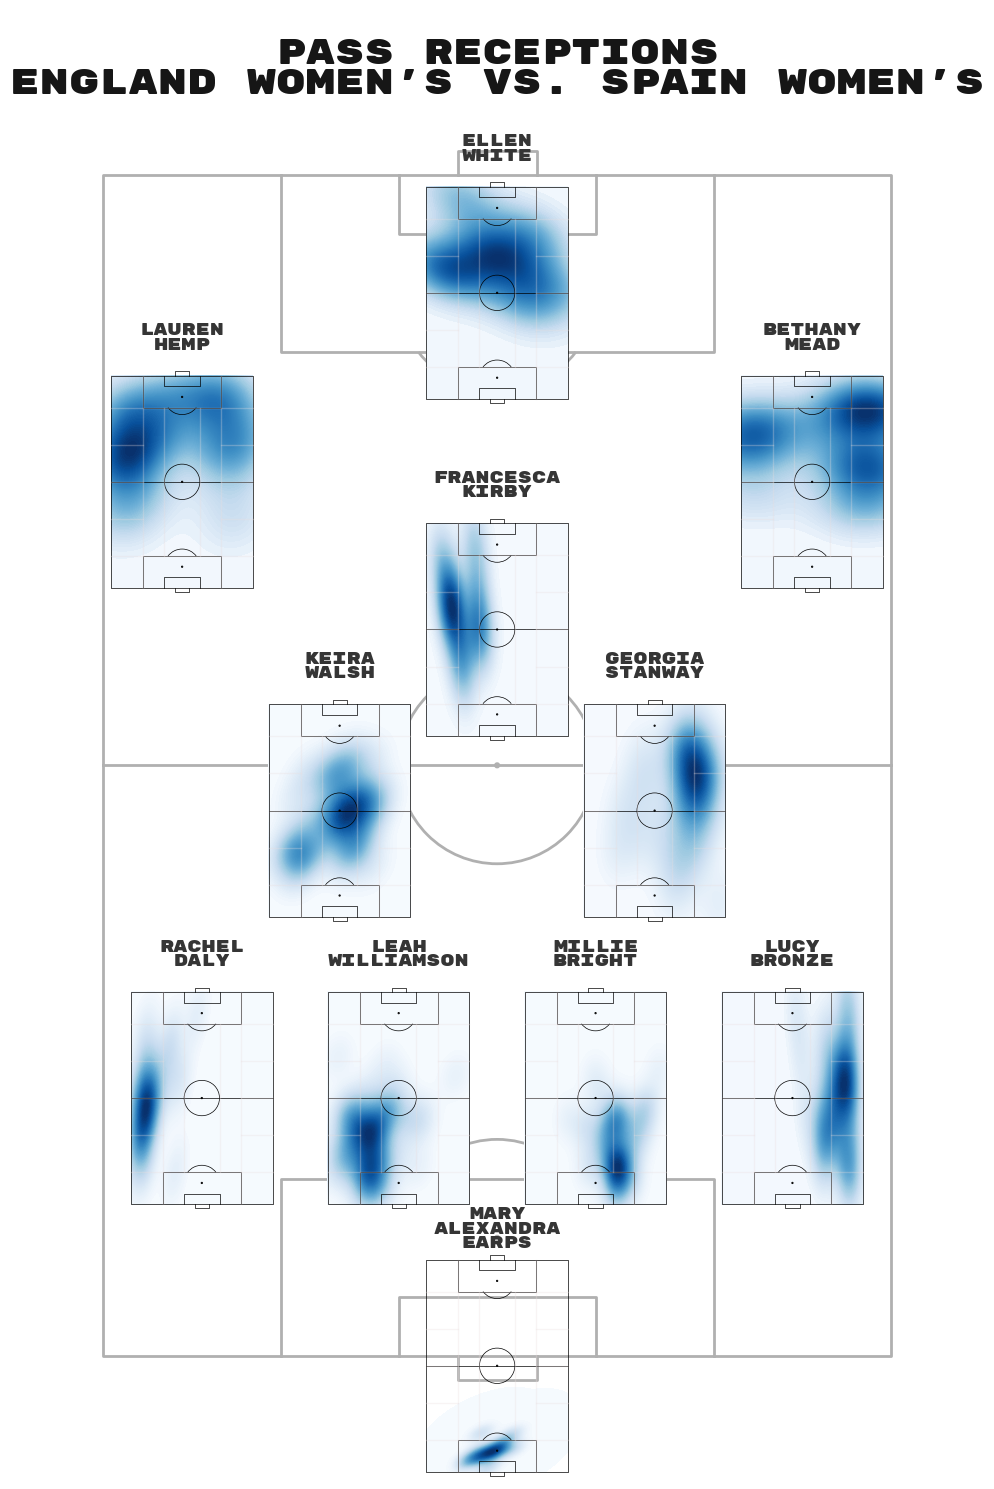
- Individual pass reception maps show the individual the range of motion and areas of onball-impact for players. This allows to understand team tendencies as well as personal preferences.
- Charting individual passing attempts helps us understand what kind of passes an athlete tends to complete and which they don’t. This knowledge provides some interesting scheming options.
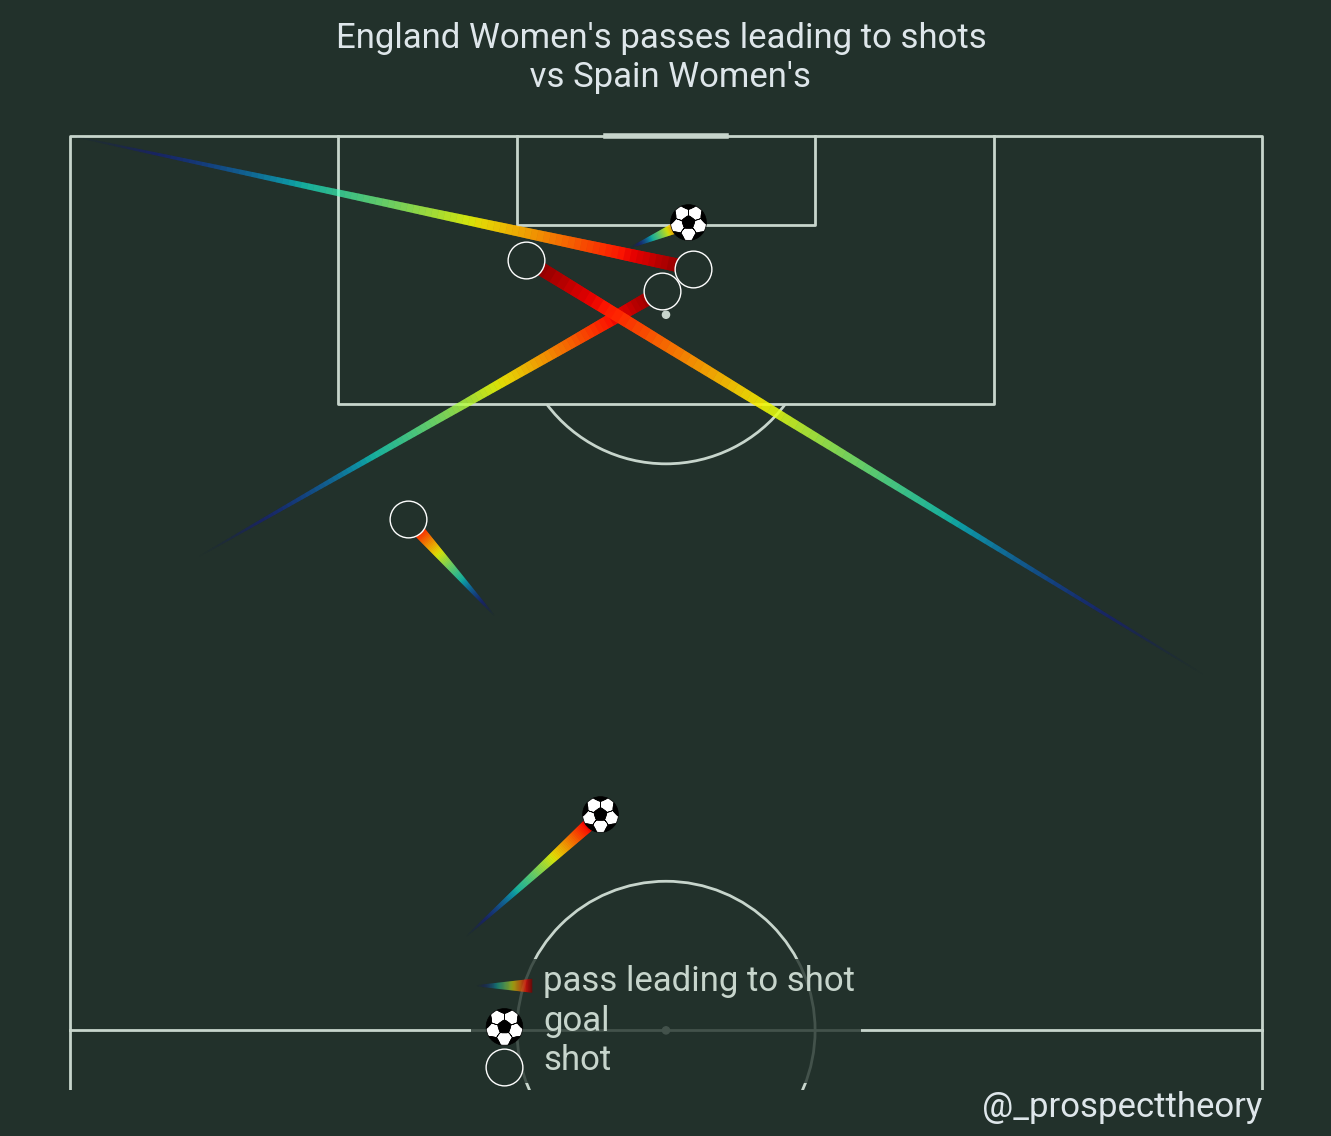
- Looking at how teams typically set up shot might help defenses to guard against such opportunities in the future.
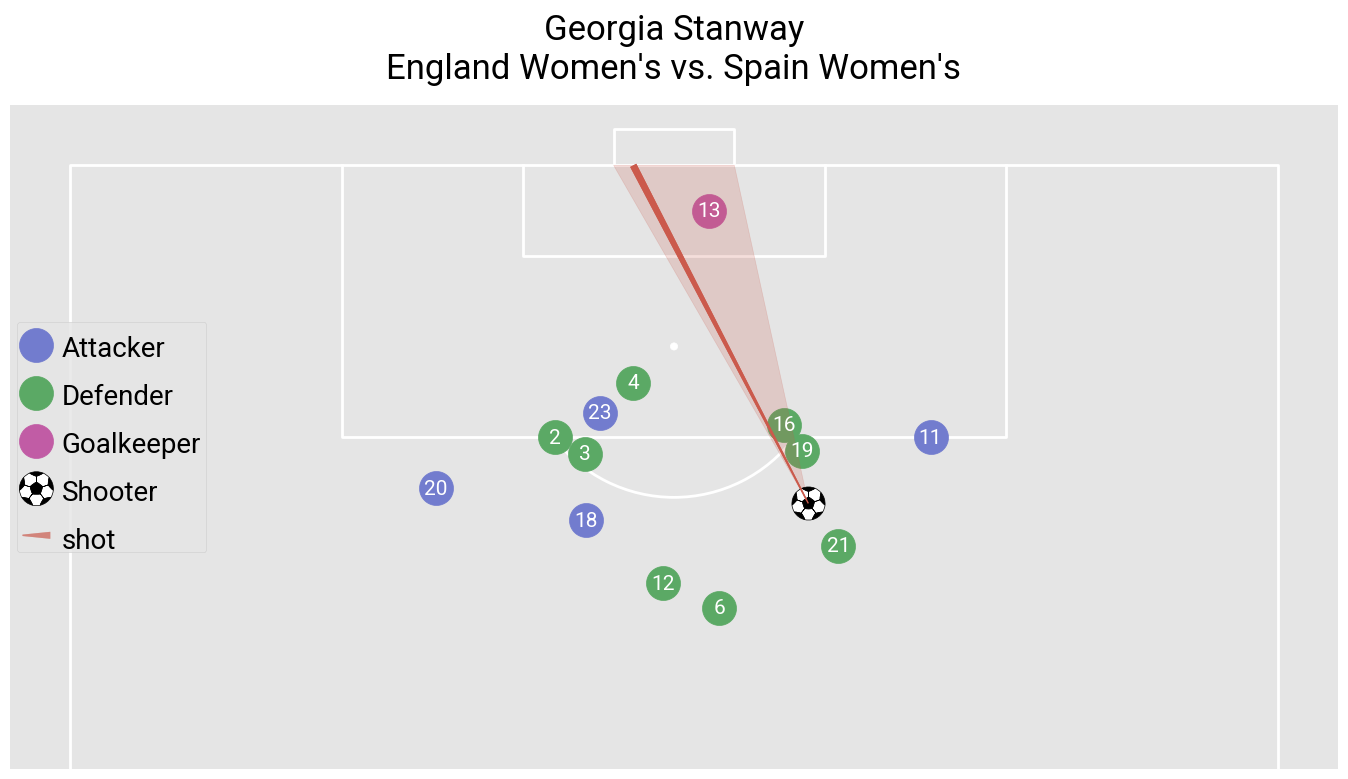
- To discect how a score happened, it can be helpful to take a snapshot at the moment of the shot and see where everybody was at.
Pressure Maps
Juego de Posición
Passing Network
Pass Receptions by Player
Mapping individual passing efforts

Passes that led to shots
Anatomy of a Goal